
2016 Boston Real Estate in Review
A Tale of Four Neighborhoods
Well the books have closed on 2016 and not surprisingly it was another red hot year for Boston area real estate. Regardless of neighborhood, supply remained steady at best and downright scarce at worst. Demand remained strong pushing prices up across the board and leaving many buyers to fight with each other for the best properties in multiple offer bidding wars. Most properties sold within a week if not mere days of coming on market. It clearly remains a sellers market.
That said, we may be seeing signs of headwinds ahead. By taking a 5 year look back on a neighborhood by neighborhood basis, we may shed some light on just where we may be going in 2017. So let’s look at 4 big and diverse ones – Back Bay, South End, South Boston, and Dorchester to see how things are trending…
The Back Bay – Luxury takes a pause…
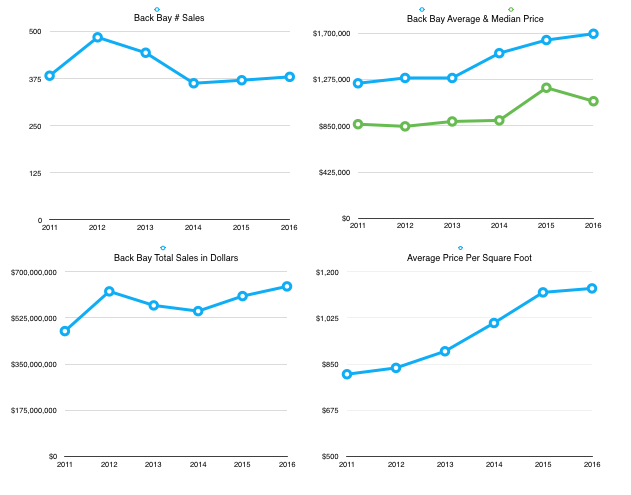
Boston’s exclusive Back Bay has seen significant price increases over the past 5 years particularly in terms of $ per square foot which in 2016 averaged over $1,100. Average price has climbed as well from just over $1.2M in 2011 to a lofty $1.7M in 2016.
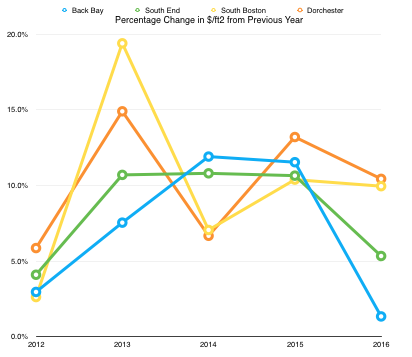
However, 2016 saw the smallest increase in price per square foot and average price (1.3% and 3.4% respectively) of any of the past 5 years, and median price actually declined slightly. The number of sales remained flat at around 380 which is typical for this neighborhood.
With average price close to $1.7M it could be that the Back Bay is starting to see some price increase resistance, plus it faces growing big money competition from trendy new Downtown and Seaport towers. That said, with the # of sales steady the neighborhood continued to sell well.
The South End – The Shelves are Still Bare…
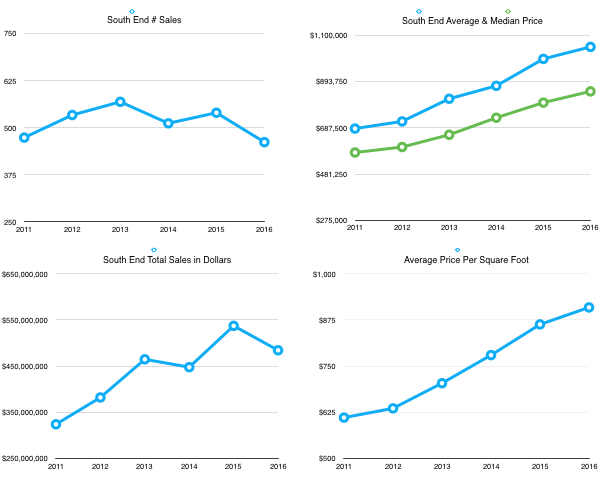
Evidently the South End has become so desirable no one wants to sell and move out! The neighborhood has been suffering from an inventory shortage for years and this year was the worst of them all. Sales were down by a whopping 14% from last year and 19% from their peak in 2013!
Notably there was no accompanying drop in price nor days on market. On the contrary, average price rose 5% – the drop in sales was clearly not related to low demand but to low supply. Buyers snapped up everything that came on. It’s basic economics that if demand remains the same (or rises), and supply falls, prices will rise and that’s what they did.
What’s interesting though is the 14% drop in supply resulted in “just” a 5% increase in price. Compare that to 2014 & 2015 where prices rose nearly 11% each year. And in those years supply was 10 – 15% higher than this year. That’s a big shift. While it’s impossible to say for sure, either demand has weakened compared to prior years and/or we are seeing the beginnings of increasing price resistance in the South End as I predicted we might in my earlier market reports. 2017 will be fascinating to watch here. If sellers come out of the shadows in any number this coming year, we may see prices flatten out even more.
South Boston – The Parade Marches On!
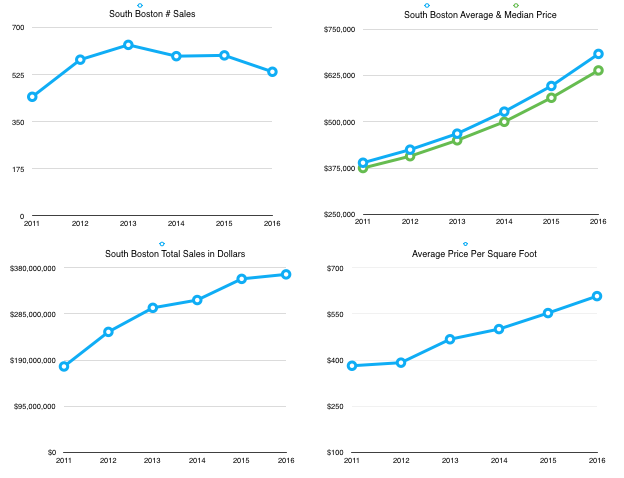
South Boston has been on a strong run for the past 5 years, benefitting from people being priced out or cashing out of the neighboring South End. Plus renovations have improved inventory quality and a more active food scene amped up interest in the area. In fact the total value of sales has more than doubled from 2011’s $175M to 2016’s $366M.
Average price rose a whopping 12.7%, beating last year’s 11.6% rise and stands at $683K today. Price per sq. ft. rose 9.9% this year over last, just shy of 2015’s 10.4% rise, making South Boston more expensive than ever. That’s still 30% cheaper on average than the neighboring South End and 64% cheaper than the Back Bay. And with 536 sales last year, South Boston had more units to sell than the Back Bay, South End, or Dorchester.
One note of caution – sales were down 10% from the previous year making it the smallest sales year since 2011. While not as severe as the situation in the South End, South Boston saw a tightening of inventory too. In this case prices still rose more than inventory dropped so demand is clearly strong, but that inventory drop could be a big part of why prices did what they did.
Dorchester – Coming On Strong!
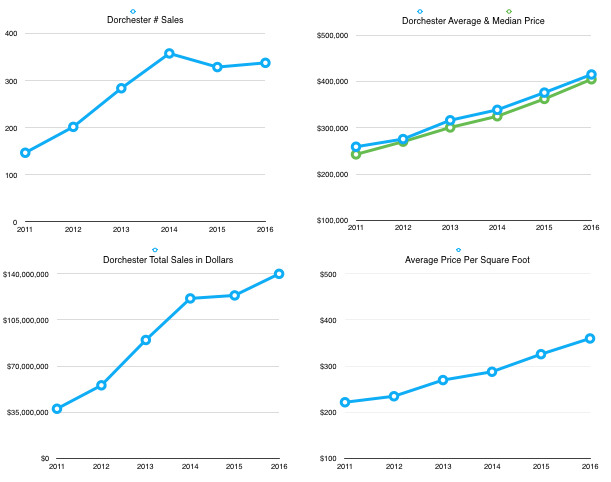
Moving south to Dorchester we see a neighborhood enjoying another growth year with 9 – 10% increases in $ per sq. ft. and average price, although a tick cooler than 2015’s red hot 13% rate. Total number of sales was also bit higher at 338 units so these increases were driven by growing demand.
At an average of just $360 per sq. ft., Dorchester remains a bargain compared to South Boston’s $608 and a steal compared to the South End’s $909 and Back Bay’s $1137. An “average” condo will cost you $415K here vs. $685K in South Boston, and over $1M in the South End. The total market has grown nearly 400% in the past five years and today’s $415K average price far exceeds its 2011 level of $259K.
Notably, the # of sales has been steady here for the past 3 years so the growth in price is demand driven, with no apparent signs of price resistance. As it continues to gentrify and prices continue to rise, I expect to see more developers being attracted to renovating older condos and 3 family buildings in the neighborhood, pushing the cycle along. Unless prices really stall out in South Boston or other competing neighborhoods, I expect Dorchester to have another very strong year in 2017.
So What About 2017?
There’s no denying 2016 was yet another banner year for Boston real estate. Happily that success was shared across quite diverse neighborhoods and I suspect 2017 will be another good year. The area economy and interest rates will play a key part of course. And after so many years of blistering growth, it’s only natural for the market to take a bit of a breather. I think we are seeing that now starting at the top of the market with Back Bay flattening and the South End price appreciation slowing.
Tellingly, while prices were still up in all 4 neighborhoods, the rate of increase was down across the board compared to 2015. If more sellers step out of the shadows to increase supply or rates make larger moves that decrease demand, that trend may intensify.
And here is how the average sale price and number of sales compared across our 4 sample neighborhoods.

What’s a Buyer or Seller to Do?
Good question! That depends on who you are…
If you are thinking of selling, this is a darn good time to get off the sidelines and sell. The strategy of waiting till next year so you’ll get much more may have run its course especially if more sellers show up.
If you are holding rental property and don’t plan to keep it long term, selling now may make even more sense as the one place we do see a glut of supply is rental housing, particularly at the high end. And so the rental market is softening (which may be another reason why we see sale price growth slowing or reversing).
If you have been thinking of buying, slowing price rises will help keep you from being priced out of the market, a very good thing. But remember a rise in interest rates remains a danger and with inventory still at record lows, I still don’t expect any big downward moves in prices. Finding and winning a place may still take months so the earlier you start the better.
So whether you are a buyer, seller, or investor, I hope you have found this report useful. And if you know of anyone who would enjoy this report, let me know and I’ll be happy to send them this and future editions!
I’d love to hear what you thought of it too, and I’d be happy to run the same analysis on your town or neighborhood. Just fill out the form below and let me know your thoughts or how I can help you with your real estate needs!
.
Note: The numbers in this report were generated by me based on MLSPIN data.and the analysis expressed is my opinion. For the purposes of easy comparison between diverse neighborhoods, only condo sales data was used and single family and multifamily sales were not inluded.